Analytics & Tracking
Back to Documentation
Overview
The SwapTopic Analytics dashboard provides detailed insights into how your personalizations are performing. Monitor views, conversions, and engagement metrics to optimize your content variations and improve conversion rates.
Performance Metrics
Rule Performance
Each personalization rule displays key metrics:
- Views: Number of times a variation has been shown to visitors
- Conversions: Number of successful conversion actions completed
- Rate: Conversion rate as a percentage (conversions divided by views)
Content Variations
For each personalized element, you can see:
- Content: The actual text or content being displayed
- Weight: Distribution percentage for A/B testing variations
- Views: Number of impressions for each content variation
- Conversions: Number of conversions attributed to each variation
- Rate: Conversion rate for each content variation
Google Analytics Integration
When enabled in Settings, SwapTopic automatically sends personalization data to your Google Analytics account:
Events Tracked in GA
SwapTopic sends two primary event types to Google Analytics:
-
View Events: Triggered when a personalized variation is shown to a visitor
Event Category: 'SwapTopic' Event Action: 'swaptopic_view' Event Label: [variation_id] Custom Dimension: 'visit_count' = [number] -
Conversion Events: Triggered when a visitor with personalized content completes a conversion
Event Category: 'SwapTopic'
Event Action: 'swaptopic_conversion'
Event Label: [variation_ids] (comma-separated list)
Custom Dimension: 'visit_count' = [number]
Setting Up Custom Reports
To analyze SwapTopic data in Google Analytics:
- Go to Customization > Custom Reports
- Create a new report with these metrics:
- Event Count
- Unique Events
- Sessions with Event
- Add these dimensions:
- Event Action
- Event Label (variation IDs)
- Add a filter for Event Category = ‘SwapTopic’
A/B Testing Analysis
Compare conversion rates between variations:
- Filter by Event Action = ‘swaptopic_view’ to see view counts by variation
- Filter by Event Action = ‘swaptopic_conversion’ to see conversion counts
- Calculate conversion rates by dividing conversions by views for each variation
Interpreting Results
Comparing Variations
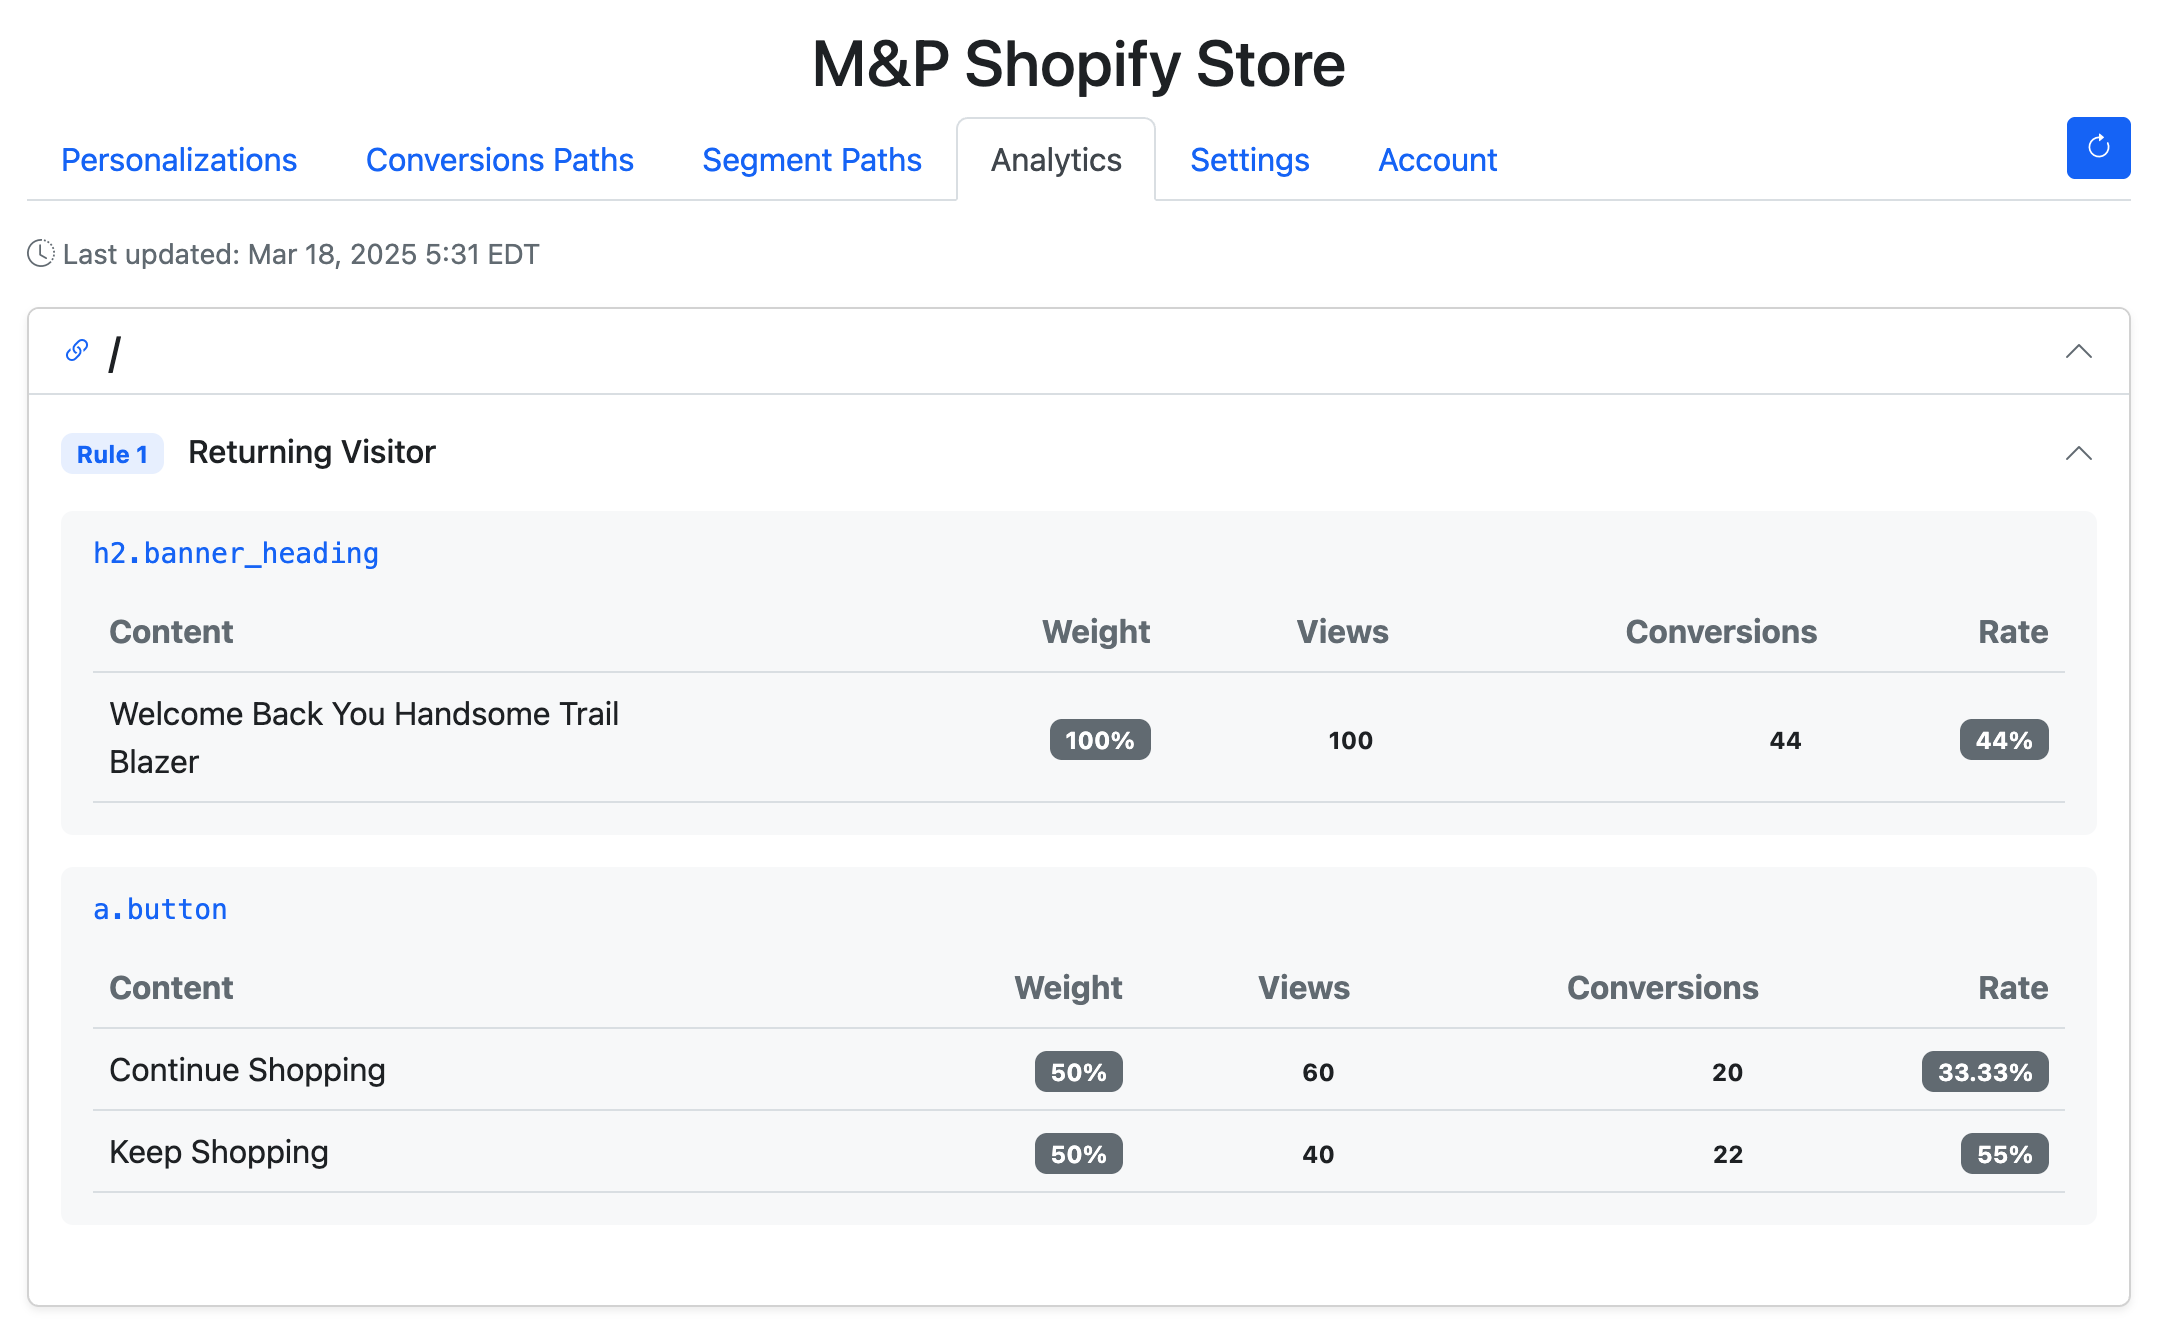
In the example shown:
- The “Keep Shopping” button variation has a 55% conversion rate compared to 33.33% for “Continue Shopping”
- This indicates “Keep Shopping” is more effective at encouraging user engagement
Statistical Significance
SwapTopic automatically calculates conversion rates, helping you identify which variations perform best. Consider:
- Higher view counts provide more reliable data
- Test variations for at least 1-2 weeks before making decisions
- Look for conversion rate differences of at least 10-15% between variations
Tracking Periods
- Last updated timestamp shows when analytics data was last refreshed
- Data is processed and updated approximately every 4 hours
- View data by day, week, or month using the date range selector
Integration with Other Analytics
SwapTopic data can be integrated with:
- Google Analytics (enable in Settings)
- Custom event tracking using the JavaScript API
- Data export for further analysis
Best Practices
- Create meaningful variations with clear hypotheses
- Run tests until you have at least 100 views per variation
- Test one element at a time for clearer results
- Use A/B testing to validate your personalization strategy
- Regularly review analytics to optimize your conversion funnel